  tour year season  event_name event_id       player_name dg_id fin_text
1  pga 2021   2021 The Masters      536 Matsuyama, Hideki 13562        1
2  pga 2021   2021 The Masters      536 Matsuyama, Hideki 13562        1
3  pga 2021   2021 The Masters      536 Matsuyama, Hideki 13562        1
4  pga 2021   2021 The Masters      536 Matsuyama, Hideki 13562        1
5  pga 2021   2021 The Masters      536   Zalatoris, Will 19428        2
6  pga 2021   2021 The Masters      536   Zalatoris, Will 19428        2
  round_num                course_name course_num course_par start_hole teetime
1         1 Augusta National Golf Club         14         72          1  9:48am
2         2 Augusta National Golf Club         14         72          1  1:00pm
3         3 Augusta National Golf Club         14         72          1  1:30pm
4         4 Augusta National Golf Club         14         72          1  2:40pm
5         1 Augusta National Golf Club         14         72          1  8:48am
6         2 Augusta National Golf Club         14         72          1 11:54am
  round_score sg_putt sg_arg sg_app sg_ott sg_t2g sg_total driving_dist
1          69   2.315  1.793  0.985  0.430  3.207    5.523        283.8
2          71  -1.732  1.479  0.291  1.292  3.062    1.330        301.9
3          65   1.796  1.318  5.635 -1.322  5.630    7.426        298.5
4          73  -1.473  1.014 -0.911  1.000  1.103   -0.370        304.3
5          70   1.538 -0.108  1.994  1.099  2.985    4.523        302.0
6          68   3.375  0.022 -0.676  1.608  0.954    4.330        301.1
  driving_acc   gir scrambling prox_rgh prox_fw great_shots poor_shots
1       0.714 0.722      1.000   44.273  38.172           7          3
2       0.786 0.778      0.429   38.792  38.045           3          3
3       0.357 0.667      0.714   50.730  10.420           7          3
4       0.714 0.611      0.636  166.794  36.691           4          5
5       0.643 0.778      0.571   35.775  38.183           6          2
6 0.857 0.611 0.600 27.118 44.845 5 32021 PGA Masters Regression Analysis
The PGA Masters is a tournament where players from all over the world come to compete in golf. Spanning four days, from Thursday to Sunday each day features a single round comprising 18 holes, showcasing some of the best golfers in the world. Out of all the PGA tours, the one in 2021 was especially exciting because of what resulted from the weather. The tournament was held at the Augusta National Golf Club in Georgia and although most days were clear, Saturday had inclement weather and the tournament had to be delayed 77 minutes. The winner of the tournament, Hideki Matsuyama, was said by the announcers to have performed even better after the weather delay. Was this the case for all the golfers? What else impacted the scores?
In this analysis I will identify the impact driving accuracy, as well as other variables, have on round score. Additionally I will evaluate the effect of the day with poor weather on the player’s performance.
Golf Terms
One thing to keep in mind about golf rules is the scoring. Unlike most sports, the lower the score, the better the golfer played. The higher the score, the worse they played. When a player starts, they begin at the tee box. Golfers start by using a club called the driver that hits the ball the farthest out of all the other clubs. The term driving describes the initial hit from the tee box.
The hole is where the player attempts to hit the ball. It is a small round hole that is surrounded by what is called the green. The green has extremely short grass and rather than using a driver or another club, golfers use a putter in this area. Another part of the course that is referenced is the fairway. The fairway is a part of the golf course that is in between the tee box and the green. This area typically has even ground and short grass.
An example of a common round would go like this: golfer hits ball from the tee box → ball lands in fairway → ball is hit to the green → ball is putted in the hole → hole is complete → repeat for next 17 holes. The steps in between the initial hit and the hole being completed can all be skipped or modified (ex. hitting the ball into sand, water, or trees). The score for the hole is how many strokes/hits it took to complete the hole. The round score is the total number of hits from all 18 holes.
For the Master’s PGA Tournament, there are four days in the tournament where each day one round (18 holes) is played.
Data Description
The data set for the PGA Masters Tournament has quantitative descriptions and calculations of how the golfers performed. Each row represents one round (18 holes/one day) of the tournament. This means that each player has four rows and many of the statistics are averages from a round.
The dependent Y variable for this analysis is round score. The round score is the cumulative number of strokes in all 18 holes. The score ranges from 65 to 84, and the average round score was 73.
The independent X variables that will be used in the analysis include driving accuracy, driving distance, round number, and strokes gained while putting.
The variable driving accuracy (driving_acc) is the percentage of drives that make it on the fairway and green. This variable will be used as the main independent variable in this analysis.
Another control variable is driving distance (driving_dist). Driving distance is the average number of yards shot in each round.
The next control variable is the round number (round_num). Round number is a variable that contains the values 1,2,3,4 where 1 is Thursday, 2 is Friday, 3 is Saturday, and 4 is the final round on Sunday. Each day/round 18 holes are played.
Finally, that last control variable is strokes gained putting (sg_putt). This is calculated using stroke averages from many other PGA tours. If a player putts better than average, then they will have a positive stroke gain calculated as the difference between the average and what they hit. For example, take a hole that is 8 feet away and the average number of putts to the hole from that distance is 1.5. If a player was able to hit the ball with 1 putt then their strokes gained would be .5.
Here are the first 6 rows of each variable in the data set:
Descriptive Tables and Graphs
The graph below shows the relationship between driving accuracy (x-axis) and round score (y-axis).
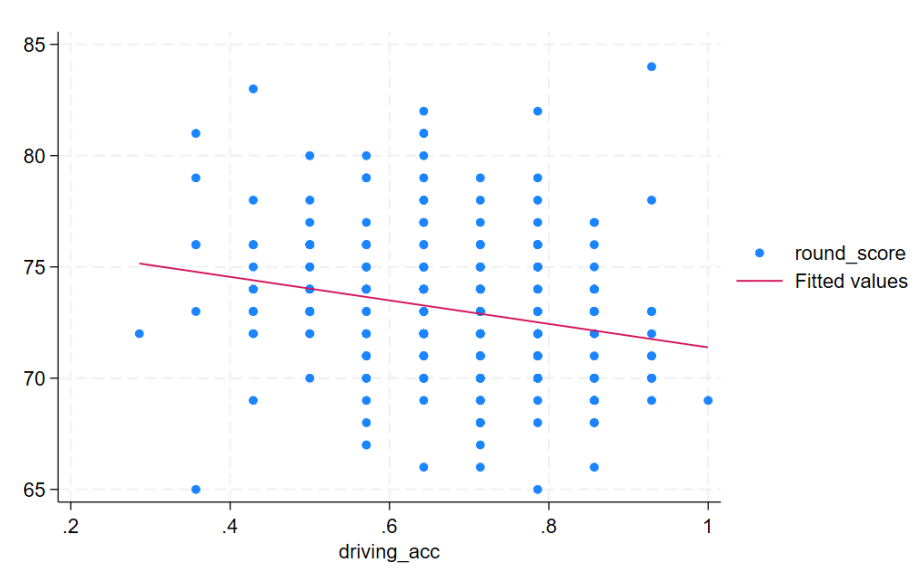
As driving accuracy increases, the round score decreases. Keep in mind that a higher score is worse and a lower score is better. Although the graph above shows a negative slope, this represents a positive relationship between driving accuracy and how well you performed in the round.
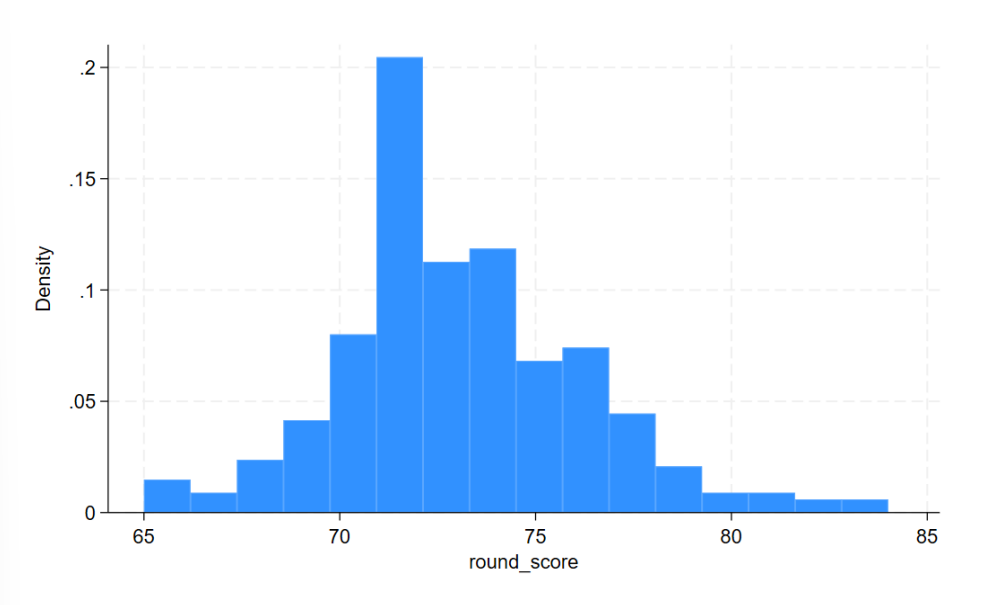
The histogram above shows the most common round scores. Most players in the tournament scored between 70 and 75 per round. The best players are on the left tail and had scores as low as 65, while the players with the worst performance are on the right tail with scores as high as 84.
Basic Regressions
The first model we will run is a regression of round score on driving accuracy.
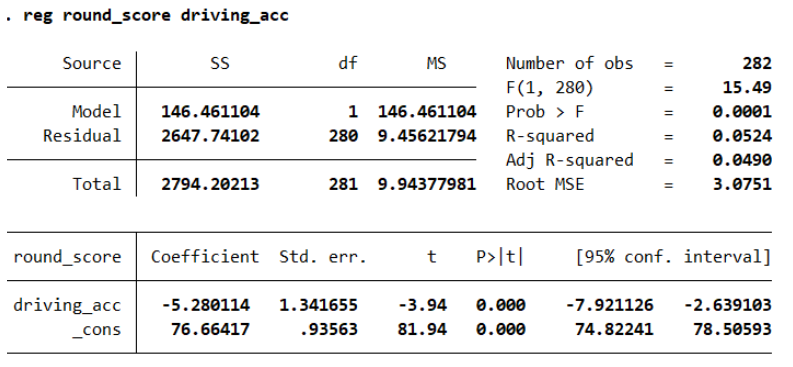
Here we can gain useful information from the coefficient on driving accuracy (driving_acc). This can be interpreted as; an additional percentage point in driving accuracy, is predicted to decrease the round score by 5.28 strokes. Therefore as driving accuracy increases, your game will improve since it is predicted to take less strokes to complete the round.
Additionally the p-value on driving accuracy is less than 0.05. This shows us that the relationship between round score and driving accuracy is statistically significant. However, there are other factors/unobservables that can impact round score, and would make the model more accurate if they were included. This brings us to our second regression model where we regress round score on driving accuracy and driving distance.
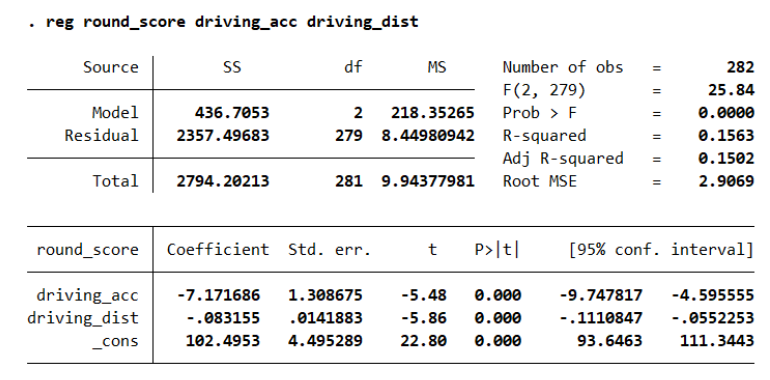
Including driving distance to the model is important because driving distance may have an impact on round score. Being able to control for driving distance will allow the model to hold the variable constant. That way, we can examine the effect on driving accuracy without the concern of the effect of driving distance impacting the coefficient on driving accuracy.
When driving distance is removed from the model, it introduces omitted variable bias. In order to calculate which direction the bias is, we must subtract the coefficient on driving accuracy in the omitted model from the coefficient on driving accuracy from the model that includes driving distance. Here is the calculation:
\[ -5.28 - (-7.17) = 1.89 > 0 \]
Since 1.89 is greater than 0, omitting driving distance results in a positive bias. The coefficient on driving accuracy is more positive without the control than when the control for distance is included.
For the next model, we will include more unobservables, so we can continue to hold them constant and examine the true effect of driving accuracy on round score.
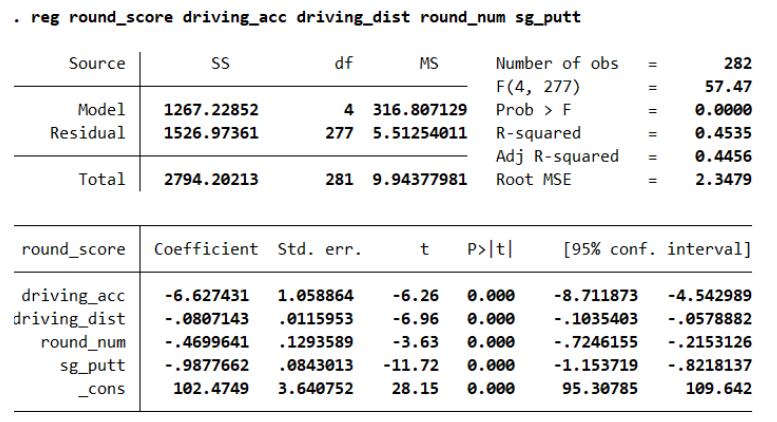
This new regression model regresses round score on driving accuracy, driving distance, round number, and strokes gained while putting. The interpretation of the coefficient on driving distance and strokes gained while putting are as follows:
Holding driving accuracy, round number, and strokes gained putting constant, an additional yard increase in driving distance (average distance of all drives in a round) is predicted to decrease round score by .08.
Holding driving accuracy, round number, and driving distance constant, an additional stroke gained while putting, is predicted to decrease the round score by .99.
Driving accuracy still has a p-value of less than .05. Therefore even when we hold all other variables constant, the effect of driving accuracy on round score is still statistically significant.
Regression with an Interaction Term
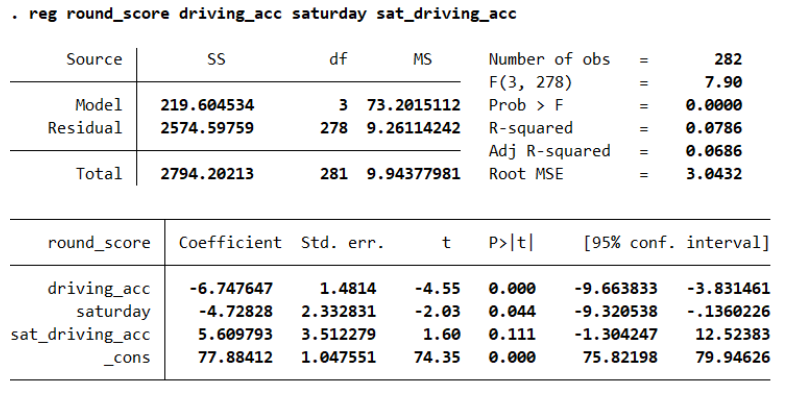
From the coefficient on the interaction term we can see that, an additional percentage point increase in driving accuracy is predicted to increase round score by 5.61 points more for Saturday than the other days of the tournament.
Saturday was the day with rain and resulted in a 77 minute delay. So, it makes sense for players to perform worse on Saturday than the other days since Saturday had worse weather conditions than the rest of the days.
On days that were not Saturday (Thursday, Friday, Sunday - no weather delays), an additional percentage point in driving accuracy is predicted to decrease score by 6.75.
Omitted Variable Bias Discussion
Many golfers say that the game is mental. I’ve even heard someone say “the best golfers don’t care at all”. This is actually shown quite clearly when watching some highlights from the tournament. The winner, Hideki Matsuyama, is composed the entire time. He does not celebrate nor does he show signs of distress. At one point in the tournament there was a rain delay and the announcers said they spoke to him after, asking what he did during the break, and he responded saying he was looking through text messages. Since golf as well as many other sports rely on having the right mindset, having a variable describing mental attributes would be beneficial to the model. Some of these variables could include nerves/stress, happiness, tiredness, etc.
Stress would most likely have a positive correlation with round score (negative correlation on performance) since the more stressed you are, most likely, the worse you perform. The same goes for driving accuracy. If you are stressed there would be a positive correlation between driving accuracy and round score since someone that is stressed may overthink and not hit the ball as accurately. Since both the independent and dependent variables have a positive correlation to stress, introducing stress would result in a positive bias.
Citations
Accessing data: https://datagolf.com/raw-data-notes
Golf definitions: https://www.wenham.golf/contact/golf-terms-and-definitions